MACD Aggressive Scalp SimpleComment on the Script
Purpose and Structure:
The script is a scalping strategy based on the MACD indicator combined with EMA (50) as a trend filter.
It uses the MACD histogram's crossover/crossunder of zero to trigger entries and exits, allowing the trader to capitalize on short-term momentum shifts.
The use of strategy.close ensures that positions are closed when specified conditions are met, although adjustments were made to align with Pine Script version 6.
Strengths:
Simplicity and Clarity: The logic is straightforward and focuses on essential scalping principles (momentum-based entries and exits).
Visual Indicators: The plotted MACD line, signal line, and histogram columns provide clear visual feedback for the strategy's operation.
Trend Confirmation: Incorporating the EMA(50) as a trend filter helps avoid trades that go against the prevailing trend, reducing the likelihood of false signals.
Dynamic Exit Conditions: The conditional logic for closing positions based on weakening momentum (via MACD histogram change) is a good way to protect profits or minimize losses.
Potential Improvements:
Parameter Inputs:
Make the MACD (12, 26, 9) and EMA(50) values adjustable by the user through input statements for better customization during backtesting.
Example:
pine
Copy code
macdFast = input(12, title="MACD Fast Length")
macdSlow = input(26, title="MACD Slow Length")
macdSignal = input(9, title="MACD Signal Line Length")
emaLength = input(50, title="EMA Length")
Stop Loss and Take Profit:
The strategy currently lacks explicit stop-loss or take-profit levels, which are critical in a scalping strategy to manage risk and lock in profits.
ATR-based or fixed-percentage exits could be added for better control.
Position Size and Risk Management:
While the script uses 50% of equity per trade, additional options (e.g., fixed position sizes or risk-adjusted sizes) would be beneficial for flexibility.
Avoid Overlapping Signals:
Add logic to prevent overlapping signals (e.g., opening a new position immediately after closing one on the same bar).
Backtesting Optimization:
Consider adding labels or markers (label.new or plotshape) to visualize entry and exit points on the chart for better debugging and analysis.
The inclusion of performance metrics like max drawdown, Sharpe ratio, or profit factor would help assess the strategy's robustness during backtesting.
Compatibility with Live Trading:
The strategy could be further enhanced with alert conditions using alertcondition to notify the trader of buy/sell signals in real-time.
Komut dosyalarını "profit factor" için ara

Backtest any Indicator v5Happy Trade,
here you get the opportunity to backtest any of your indicators like a strategy without converting them into a strategy. You can choose to go long or go short and detailed time filters. Further more you can set the take profit and stop loss, initial capital, quantity per trade and set the exchange fees. You get an overall result table and even a detailed, scroll-able table with all trades. In the Image 1 you see the provided info tables about all Trades and the Result Summary. Further more every trade is marked by a background color, Labels and Levels. An opening Label with the trade direction and trade number. A closing Label again with the trade number, the trades profit in % and the total amount of $ after all past trades. A green line for the take profit level and a red line for the stop loss.
Image 1
Example
For this description we choose the Stochastic RSI indicator from TradingView as it is. In Image 2 is shown the performance of it with decent settings.
Timeframe=45, BTCUSD, 2023-08-01 - 2023-10-20
Stoch RSI: k=30, d=40, RSI-length=140, stoch-length=140
Backtest any Indicator: input signal=Stoch RSI, goLong, take profit=9.1%, stop loss=2.5%, start capital=1000$, qty=5%, fee=0.1%, no Session Filter
Image 2
Usage
1) You need to know the name of the boolean (or integer) variable of your indicator which hold the buy condition. Lets say that this boolean variable is called BUY. If this BUY variable is not plotted on the chart you simply add the following code line at the end of your pine script.
For boolean (true/false) BUY variables use this:
plot(BUY ? 1:0,'Your buy condition hold in that variable BUY',display = display.data_window)
And in case your script's BUY variable is an integer or float then use instate the following code line:
plot(BUY ,'Your buy condition hold in that variable BUY',display = display.data_window)
2) Probably the name of this BUY variable in your indicator is not BUY. Simply replace in the code line above the BUY with the name of your script's trade condition variable.
3) Save your changed Indicator script.
4) Then add this 'Backtest any Indicator' script to the chart ...
5) and go to the settings of it. Choose under "Settings -> Buy Signal" your Indicator. So in the example above choose .
The form is usually: ' : BUY'. Then you see something like Image 2
6) Decide which trade direction the BUY signal should trigger. A go Long or a go Short by set the hook or not.
Now you have a backtest of your Indicator without converting it into a strategy. You may change the setting of your Indicator to the best results and setup the following strategy settings like Time- and Session Filter, Stop Loss, Take Profit etc. More of it below in the section Settings Menu.
Appereance
In the Image 2 you see on the right side the List of Trades . To scroll down you go into the settings again and decrease the scroll value. So you can see all trades that have happened before. In case there is an open trade you will find it at the last position of the list.
Every Long trade is green back grounded while Short trades are red.
Every trade begins with a label that show goLong or goShort and its number. And ends with another label again with its number, Profit in % and the resulting total amount of cash.
If activated you further see the Take Profit as a green line and the Stop Loss as a orange line. In the settings you can set their percentage above or below the entry price.
You also see the Result Summary below. Here you find the usual stats of a strategy of all closed trades. The profit after total amount of fees , amount of trades, Profit Factor and the total amount of fees .
Settings Menu
In the settings menu you will find the following high-lighted sections. Most of the settings have a question mark on their right side. Move over it with the cursor to read specific explanation.
Input Signal of your Indicator: Under Buy you set the trade signal of your Indicator. And under Target you set the value when a trade should happen. In the Example with the Stochastic RSI above we used 20. Below you can set the trade direction, let it be go short when hooked or go long when unhooked.
Trade Settings & List of Trades: Take Profit set the target price of any trade. Stop Loss set the price to step out when a trade goes the wrong direction. Check mark the List of Trades to see any single trade with their stats. In case that there are more trades as fits in the list you can scroll down the list by decrease the value Scroll .
Time Filter: You can set a Start Time or deactivate it by leave it unhooked. The same with End Time .
Session Filter: here you can choose to activate it on weekly base. Which days of the week should be trading and those without. And also on daily base from which time on and until trade are possible. Outside of all times and sessions there will be no new trades if activated.
Invest Settings: here you can choose the amount of cash to start with. The Quantity percentage define for every trade how much of the cash should be invested and the Fee percentage which have to be payed every trade. Open position and closing position.
Other Announcements
This Backtest script don't use the strategy functions of TradingView. It is programmed as an indicator. All trades get executed at candle closing. This script use the functionality "Indicator-on-Indicator" from TradingView.
Conclusion
So now it is your turn, take your promising indicators and connect it to that Backtest script. With it you get a fast impression of how successful your indicator will trade. You don't have to relay on coders who maybe add cheating code lines. Further more you can check with the Time Filter under which market condition you indicator perform the best or not so well. Also with the Session Filter you can sort out repeating good market conditions for your indicator. Even you can check with the GoShort XOR GoLong check mark the trade signals of you indicator in opposite trade direction with one click. And compare your indicators under the same conditions and get the results just after 2 clicks. Thanks to the in-build fee setting you get an impression how much a 0.1% fee cost you in total.
Cheers

Strategy Myth-Busting #20 - HalfTrend+HullButterfly - [MYN]#20 on the Myth-Busting bench, we are automating the " I Found Super Easy 1 Minute Scalping System And Backtest It 100 Times " strategy from " Jessy Trading " who claims 30.58% net profit over 100 trades in a couple of weeks with a 51% win rate and profit factor of 1.56 on EURUSD .
This one surprised us quite a bit. Despite the title of this strategy indicating this is on the 1 min timeframe, the author demonstrates the backtesting manually on the 5 minute timeframe. Given the simplicity of this strategy only incorporating a couple of indicators, it's robustness being able to be profitable in both low and high timeframes and on multiple symbols was quite refreshing.
The 3 settings which we need to pay most attention to here is the Hull Butterfly length, HalfTrend amplitude and the Max Number Of Bars Between Hull and HalfTrend Trigger. Depending on the timeframe and symbol, these settings greatly impact the performance outcomes of the strategy. I've listed a couple of these below.
And as always, If you know of or have a strategy you want to see myth-busted or just have an idea for one, please feel free to message me.
This strategy uses a combination of 3 open-source public indicators:
Hull Butterfly Oscillator by LuxAlgo
HalfTrend by Everget
Trading Rules
5 min candles but higher / lower candles work too.
Stop loss at swing high/low
Take Profit 1.5x the risk
Long
Hull Butterfly gives us green column, Wait for HalfTrend to present an up arrow and enter trade.
Short
Hull Butterfly gives us a red column , Wait for HalfTrend to present a down arrow and enter trade.
Alternative Trading Settings for different time frames
1 Minute Timeframe
Move the Hull Butterfly length from the default 11 to 9
Move the HalfTrend Amplitude from the default 2 to 1
Enabling ADX Filter with a 25 threshold
2 Hour Timeframe
Move the HalfTrend Amplitude from the default 2 to 1
Laddered Take Profits from 14.5% to 19% with an 8% SL

SUPPORT RESISTANCE STRATEGY [5MIN TF]A SUPPORT RESISTANCE BREAKOUT STRATEGY for 5 minute Time-Frame , that has the time condition for Indian Markets
The Timing can be changed to fit other markets, scroll down to "TIME CONDITION" to know more.
The commission is also included in the strategy .
The basic idea is when ,
1) Price crosses above Resistance Level ,indicated by Red Line, is a Long condition.
2) Price crosses below Support Level ,indicated by Green Line , is a Short condition.
3) Candle high crosses above ema1, is a part of the Long condition .
4) Candle low crosses below ema1, is a part of the Short condition .
5) Volume Threshold is an added confirmation for long/short positions.
6) Maximum Risk per trade for the intraday trade can be changed .
7) Default qty size is set to 50 contracts , which can be changed under settings → properties → order size.
8) ATR is used for trailing after entry, as mentioned in the inputs below.
// ═════════════════════════//
// ————————> INPUTS <————————— //
// ═════════════════════════//
→ L_Bars ———————————> Length of Resistance / Support Levels.
→ R_Bars ———————————> Length of Resistance / Support Levels.
→ Volume Break ———————> Volume Breakout from range to confirm Long/Short position.
→ Price Cross Ema —————> Added condition as explained above (3) and (4).
→ ATR LONG —————————> ATR stoploss trail for Long positions.
→ ATR SHORT ————————> ATR stoploss trail for Short positions.
→ RISK ————————————> Maximum Risk per trade intraday.
The strategy was back-tested on TCS ,the input values and the results are mentioned under "BACKTEST RESULTS" below.
// ═════════════════════════ //
// ————————> PROPERTIES<——————— //
// ═════════════════════════ //
Default_qty_size ————> 50 contracts , which can be changed under
Settings
↓
Properties
↓
Order size
// ═══════════════════════════════//
// ————————> TIME CONDITION <————————— //
// ═══════════════════════════════//
The time can be changed in the script , Add it → click on ' { } ' → Pine editor→ making it a copy [right top corner} → Edit the line 27.
The Indian Markets open at 9:15am and closes at 3:30pm.
The 'time_cond' specifies the time at which Entries should happen .
"Close All" function closes all the trades at 3pm , at the open of the next candle.
To change the time to close all trades , Go to Pine Editor → Edit the line 92 .
All open trades get closed at 3pm , because some brokers don't allow you to place fresh intraday orders after 3pm .
// ═══════════════════════════════════════════════ //
// ————————> BACKTEST RESULTS ( 100 CLOSED TRADES )<————————— //
// ═══════════════════════════════════════════════ //
INPUTS can be changed for better Back-Test results.
The strategy applied to NSE:TCS ( 5 min Time-Frame and contract size 50) gives us 60% profitability , as shown below
It was tested for a period a 6 months with a Profit Factor of 1.8 ,net Profit of 30,000 Rs profit .
Sharpe Ratio : 0.49
Sortino Ratio : 1.4
The graph has a Linear Curve with Consistent Profits.
The INPUTS are as follows,
1) L_Bars —————————> 4
2) R_Bars —————————> 4
3) Volume Break ————> 5
4) Price Cross Ema ——> 100
5) ATR LONG ——————> 2.4
6) ATR SHORT —————> 2.6
7) RISK —————————> 2000
8) Default qty size ——> 50
NSE:TCS
Save it to favorites.
Apply it to your charts Now !!
Thank You ☺ NSE:TCS

PIVOT STRATEGY [INDIAN MARKET TIMING]
A Back-tested Profitable Strategy for Free!!
A PIVOT INTRADAY STRATEGY for 5 minute Time-Frame , that also explains the time condition for Indian Markets
The Timing can be changed to fit other markets, scroll down to "TIME CONDITION" to know more.
The commission is also included in the strategy .
The basic idea is when ,
1) Price crosses above ema1 ,indicated by pivot highest line in green color .
2) Price crosses below ema1 ,indicated by pivot lowest line in red color .
3) Candle high crosses above pivot highest , is the Long condition .
4) Candle low crosses below pivot lowest , is the Short condition .
5) Maximum Risk per trade for the intraday trade can be changed .
6) Default_qty_size is set to 60 contracts , which can be changed under settings → properties → order size .
7) ATR is used for trailing after entry, as mentioned in the inputs below.
// ═════════════════════════//
// ————————> INPUTS <————————— //
// ═════════════════════════//
Leftbars —————> Length of pivot highs and lows
Rightbars —————> Length of pivot highs and lows
Price Cross Ema —————> Added condition
ATR LONG —————> ATR stoploss trail for Long positions
ATR SHORT —————> ATR stoploss trail for Short positions
RISK —————> Maximum Risk per trade for the day
The strategy was back-tested on RELIANCE ,the input values and the results are mentioned under "BACKTEST RESULTS" below .
// ═════════════════════════ //
// ————————> PROPERTIES<——————— //
// ═════════════════════════ //
Default_qty_size ————> 60 contracts , which can be changed under settings
↓
properties
↓
order size
// ═══════════════════════════════//
// ————————> TIME CONDITION <————————— //
// ═══════════════════════════════//
The time can be changed in the script , Add it → click on ' { } ' → Pine editor→ making it a copy [right top corner} → Edit the line 25 .
The Indian Markets open at 9:15am and closes at 3:30pm .
The 'time_cond' specifies the time at which Entries should happen .
"Close All" function closes all the trades at 3pm, at the open of the next candle.
To change the time to close all trades , Go to Pine Editor → Edit the line 103 .
All open trades get closed at 3pm , because some brokers don't allow you to place fresh intraday orders after 3pm .
NSE:RELIANCE
// ═══════════════════════════════════════════════ //
// ————————> BACKTEST RESULTS ( 128 CLOSED TRADES )<————————— //
// ═══════════════════════════════════════════════ //
INPUTS can be changed for better back-test results.
The strategy applied to NIFTY ( 5 min Time-Frame and contract size 60 ) gives us 60% profitability y , as shown below
It was tested for a period a 6 months with a Profit Factor of 1.45 ,net Profit of 21,500Rs profit .
Sharpe Ratio : 0.311
Sortino Ratio : 0.727
The graph has a Linear Curve with consistent profits .
The INPUTS are as follows,
1) Leftbars ————————> 3
2) Rightbars ————————> 5
3) Price Cross Ema ——————> 150
4) ATR LONG ————————> 2.7
5) ATR SHORT ———————> 2.9
6) RISK —————————> 2500
7) Default qty size ——————> 60
NSE:RELIANCE
Save it to favorites.
Apply it to your charts Now !!
↓
FOLLOW US FOR MORE !
Thank me later ;)

TUE ADX/MACD Confluence V1.0The ADX and MACD confluence can be a powerful predictor in stock movements. This script will help you find those confluences in an easy to understand visual manner.
It includes Buy and Sell signals for detected confluences, and will show colored candles to help you determine when to exit a trade. When the candles turn to white that means the detected confluence is no longer in play and you may want to consider a trailing stop loss.
The Buy and Sell signals will display on the first occurrence of each confluence.
It's important to understand that both of these are lagging indicators, but with a careful attention to your stoploss you can easily generate a positive profit factor.
This code is provided open source and you're free to use it for any purpose other than resale.

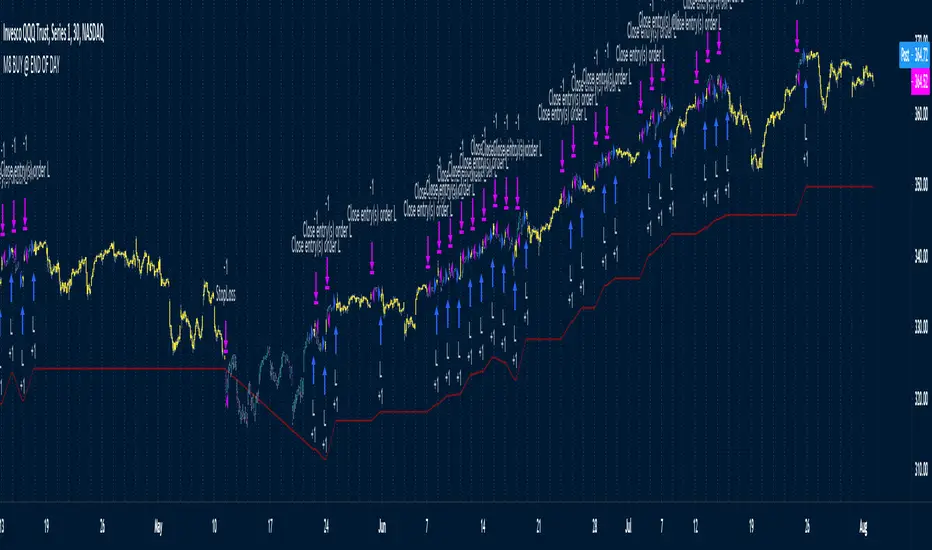
M8 BUY @ END OF DAYI've read a couple of times at a couple of different places that most of the move in the market happens after hours, meaning during non-standard trading hours.
After-market and pre-market hours and have seen data presented showing that systems which bought just before end normal market hours and sold the next morning had really amazing resutls.
But when testing those I found the results to be quite poor compared to the pretty graphs I saw, and after much tweaking and trying different ideas I gave up on the idea until I recently decided to try a new position management system.
The System
Buys at the end of the trading day before the close
Sells the next morning at the open IF THE CLOSE OF THE CURRENT BAR IS HIGHER THAN THE ENTRY PRICE
When the current price is not higher, the system will keep the position open until it EITHER gets stops out or closes on profit <<< this is WHY it has the high win %
The system has a high win ratio because it will keep that one position open until it either reaches profit or stops out
This "system" of waiting, and keeping the trade open, actually turned out to be a fantastic way to kind of put the complete trading strategy in a kind of limbo mode. It either waits for market failure or for a profit.
I don't really care about win % at all, almost always high win % ratio systems are just nonsense. What I look for is a PF -- profit factor of 1.5 or above, and a relatively smooth equity curve. -- This has both.
The Stop Loss setting is set @ .95, meaning a 5% stop loss. The Red Line on the chart is the stop loss line.
There is no set profit target -- it simply takes what the market gives.
Non-Repainting System
This does use a 200D Simple Moving Average as a filter. Like a Green Light / Red Light traffic light, the system will only trade long when the price is above its 200 Moving average.
Here is the code: "F1 = close > sma(security(syminfo.tickerid, "D", close ), MarketFilterLen) // HIGH OF OLD DATA -- SO NO REPAINTING"
I use "close ", so that's data from two days ago, it's fixed, confirmed, non-repainting data from the higher timeframe.
-- I would only suggest using this on direction tickers like SPY, QQQ, SSO, TQQQ, market sectors with additional filters in place.
10PreBuyerQuite a simple system
Uses a moving average, the blue line to try and get filled at favorable prices
The MA is multiplied by a number (e.g. .90) which means the system tries to get filled at a 10% lower price (on the Blue MA line)
This means that stop limit buy orders have to be set in advance on the blue line and hope that they would get filled when there is a temporary drop in price
This obviously works best on tickers with a clear long-term up direction
The multiplier can be set to .95 to try and get in on 5% drops instead of 10% drops
"Prof TRG %" determines what profit target you'd like the system to use, default is 1.2 meaning a 20% target, but 1.05, 1.10, and 1.30 would also be good considerations
"Loss TRG %" determines what stop-loss target you'd like the system to use, default is 0.90, meaning 10% stop loss, but, .95, and .85 would also be good considerations
The Profit Target line is green
The Stop Loss target line is red
Using the combination of the Stop Loss inputs and Profit Target inputs you can determine your own RR (Risk to reward ratios), for example, 1:1, 2:1, 3:1, 5:1
Let me know if anything is unclear and I'll try to clarify.
Again, this system assumes that you'll have waiting stop limit orders that are trying to get filled on the blue line, is below price most of the time -- so it's trying to get in on temporary drops on instruments that have a long term uptrend.
1:1 RR ratio would mean high win %
1:5 RR ratios would mean low win %
Not that win % matters, the important things IMO to pay attention to is Profit Factor and a relatively smooth equity cruve

BB21_MA200_StrategyThis strategy follows the trend and keeps you in the trend until it breaks SMA 200
SMA setting is 200
BB setting is 21
BUY
====
when BB is (lower band and upper band) above SMA 200 and price crossing above BB middle line
Partial Exit
==========
When Lower BB crossing down SMA200 , exit 30%
Total Exit
=========
When BB middle band crosses down SMA200 , exit ALL
Stop Loss
======
default is set to 5%
Risk Management
================
This is new parameter I have introduced in my strategies. Default value is 10% . That means , if your capital is 10000 , you are willing to risk 10% of it ... i.e 1000.
It doesnot mean that you are buying shares/units for 1000 only. It is different ...see below
Your trade size is calculated based on Risk% .... capital x risk 5 / stop Loss units
for further explanation you can check Alexander Elder's risk management rule. He mentioned 2% rule for 100K account. But most of us dont have 100K accounts .. . so I have defaulted 10% on 10K account. You can change this values and see the results. It wont change the number of trades or profit factor. It will increase the net profit.
Warning
=======
For educational purposes only

FTSMA - Trend is your frendThis my new solid strategy: if you belive that "TREND IS YOUR FRIEND" this is for you!
I have tested with many pairs and at many timeframes and have profit with just minor changes in settings.
I suggest to use it for intraday trading .
VERY IMPORTANT NOTE: this is a trend following strategy, so the target is to stay in the trade as much as possible. If your trading style is more focused on scalping and/or pullbaks, this strategy is not for you.
This strategy uses moving averages applied to Fourier waves for forecasting trend direction.
How strategy works:
- Buy when fast MA is above mid MA and price is above slow MA, which acts as a trend indicator.
- Sell when fast MA is below mid MA and price is below slow MA, which acts as a trend indicator.
Strategy uses a lot of pyramiding orders because when you are in a flat market phase it will close 1 or 2 orders with a loss, but when a big trend starts, it will have profit in a lot of orders.
So, if you analize carefully the strategy results, you will note that "Percent Profitable" is very low (30% in this case) because strategy opened a lot of orders also in flat markets with small losses, BUT "Avg # bars in winning trades" is very high and overall Profit is very high: when a big trend starts, orders are kept open for long time generating big profits.
Thanks to all pinescripters mentioned in the code for their snippets.
I have also a study with alerts. Next improvement (only to whom is interested to this script and follows me): study with alerts on multiple tickers all at one. Leave a comment if you want to have access to study.
HOW TO USE STRATEGY AND STUDY TOGHETER:
1- Add to chart the strategy first, so your workspace will be as clean as possible.
2- Open the Strategy Tester tab at footer of the page.
3- Modify settings to get best results (Profit, Profit Factor, Drawdown).
4- Add study with alerts to your chart with same setting of strategy.
I WILL PROVIDE A DETAILED QUICK INSTALLATION GUIDE WITH THE STUDY!
Please use comment section for any feedback or contact me if you need support.

Patient Trendfollower (7)(alpha)Patient Trendfollower consists of 21 and 55 EMA, Commodity Channel Index and Supertrend indicator. It confirms a trend and gives you a signal on a pullback. Original creation worked on 1h EURUSD chart.
►Long setup:
• 21 EMA is above 55 EMA, which is above the Supertrend indicator.
• Commodity Channel Index is an oscillator, which prints into the chart if extreme levels are reached. Green is for a level above 100 or below -100, red is above 140 or below -140 and black is above 180 or below -180.
• If 21 EMA > 55EMA > Supertrend and an oversold signal appear, you can buy into the trend.
• When backtesting on 1h EURUSD, profit target 400 pips worked best with a stop-loss below Supertrend's bottom and the size of your spread.
• A picture shows two valid entries.
: This part still malfunctions and shows red dots over some green ones. It is important to disable red ones in the settings to see green ones.
Some more long signals:
Some short signals:
►Backtesting data with default settings and trading only green CCI signals with mentioned risk management strategy:
• 212 closed trades
• 58.96% profitable with average win trade 348 USD and average loss trade 263 USD when only green signals are followed.
• Profit factor 1.903, Sharpee 0.792
• 20 bars is average for all trades, short trades were 18 bars long on average.
With given data, you can see the strategy is profitable by itself. However, original risk management settings do work only on 1h charts of EURUSD and would need to be adjusted for other instruments based on average volatility.
Even though the profitability is low, you can increase your odds by a great margin, if you properly use price action (impulsive and corrective moves, patterns, bar analysis), if you trade when major exchanges are open, you may also use wave analysis such as Elliot Waves or Market Profiles to predict whether the next day might be a trending day. My backtesting program didn't consider these ideas.
Unfortunately, I won't be making backtesting strategy public with it anytime soon, because it still has some parts that do not work. I am ok with that since I understand the code and know what does malfunction and how. Then, there are parts which I am not sure how to fix yet. This is why the indicator is still considered alpha.
In the future when a strategy is published, you will also be able to set your own overbought/oversold values without entering the code itself and probably some other features. But I am not in a hurry for that. You can give me feedback on UX and try to figure out the best setups for other symbols, it might help to improve the automatic testing script when I know what I should achieve. My main point is to make this public for friends who can already be using it on EURUSD at least.
Close doesn't always have to be 400 pips, you might want to close on a logical level such as strong resistance or a trendline too.
Thanks to:
• @everget for providing Supertrend solution.
• Satik FX who hand-tested the system by hand and reported results in this article . He is my main inspiration for creating the complete indicator as one because I want to be able to show and hide it with a single click. My future scripts will also work as a whole strategy each by itself.
• The number in the script's name comes from Satik's numbering. A mentioned article was his seventh shared strategy.

BitMEX pump catcher - MACDThis is a modified version of the BitMEX pump catcher by Jomy .
I have tweaked the algorithm to use the difference in MACD to get the correct direction of entries rather than using direction of candles which are not always indicative of trend direction. These changes increase net profit, profitable trades, while reducing drawdown.
Below is a copy and paste of Jomy's explanation of the algorithm.
What is going on here? This strategy is pretty simple. We start by measuring a very long chunk of volume history on BitMEX:XBTUSD 1 hour chart to find out if the current volume is high or low. At 1.0 the indicator is showing we are at 100% of normal historical volume . The blue line is a measure of recent volume! This indicator gets interested when the volume drops below 90% of the regular volume (0.9), and then comes back up over 90%. There's usually a pump of increased price activity during this time. When the 0.9 line is crossed by the blue line, the indicator surveys the last 2 bars of price action to figure out which way we're going, long or short. Green is long. Red is short. To exit the trade we use a 7 period fast ema of the volume crossing under an 11 ema slower period which shows declining interest in the market signifying an end to the pump or dump. The profit factor is quite high with 5x leverage, but historically we see 50% drawdown -- very risky. 1x leverage looks nice and tight with very low drawdown. Play with the inputs to see what matches your own risk profile. I would not recommend taking this into much lower timeframes as trading fees are not included in the profit calculations. Please don't get burned trading on stupid high leverage. This indicator is probably not going to work well on alts, as Bitcoin FOMO build up and behavior is different. This whole indicator is tuned to Bitcoin , and attempts to trade only the meatiest part of the market moves.
Jomy should get full credit to this indicator

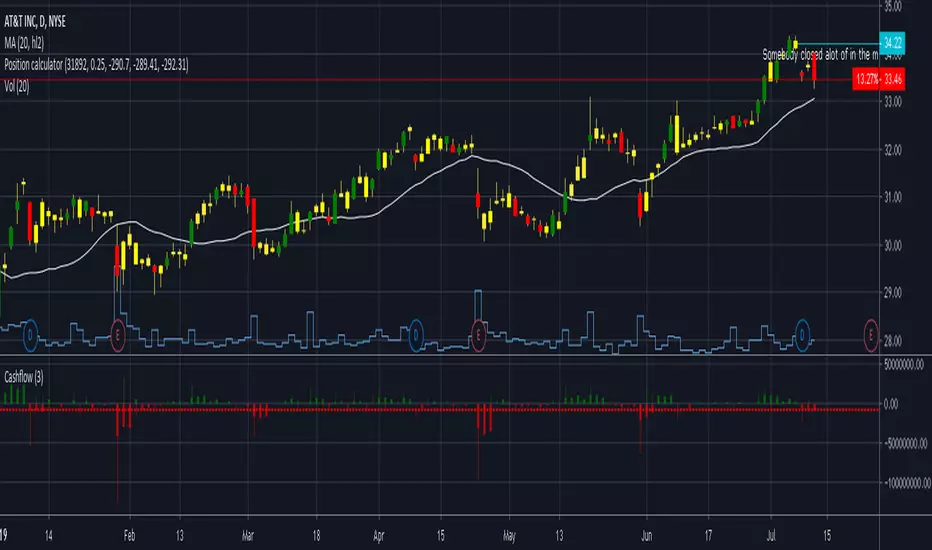
Position calculatorThis position calculator can be used to see if the potential trade is a good one. Enter the values as inputs and the output will be listed next to the settings of the indicator. Nearest support/resistance is meant to be your price target. I have found running this analysis prior to a trade to be helpful. This will output number of shares to buy/sell based on your risk percent and then also give a potential profit factor. I wish the outputs in Tradingview were cleaner but this works for now. Let me know if you have any questions or suggestions. Happy trading!
CCI Level Zero Strategy (by Marcoweb) v1.0Hi guys,
My strategy is ready :)
Finally the zero level of the CCI gives the start and stop to my positions. As you could notice, setting up the CCI length to 340 area on 1 minute chart will let the profit factor go up to 20% from an already wonderful 16%. This is a great result cause will let profitable trades run while stopping the wrong ones with a very limited loss. What makes our profit are not several small little positions that are clearly unrepitable in real trade but few and very profitable positions in which jumping in will be easier due to their length (71 bars average).
Please share with me your impressions and suggestions.
Have a nice trade :)

The Essa System V1.5The Essa System V1.5
Overview
The Essa System is a comprehensive trading strategy and backtesting tool designed for traders who use market structure and Fibonacci retracements. It automatically identifies significant trading ranges, calculates key retracement levels, and then backtests a complete trading strategy based on entries at these levels.
This is more than just an indicator; it's a full suite of analytical tools designed to help you develop, test, and analyze a complete trading plan directly on your chart.
How It Works
The system's logic is based on a classic price action concept:
Range Detection: First, it automatically identifies a significant trading range by finding the highest high and lowest low based on pivot points over a user-defined lookback period.
Fibonacci Analysis: Once the range direction (bullish or bearish) is established, the script calculates and displays key Fibonacci retracement levels (50%, 61.8%, 70.5%, and 78.6%).
Trade Execution: The system then looks for historical and live trading opportunities, entering a trade when the price pulls back to one of the enabled Fibonacci levels. All trades are managed with a predefined Stop Loss and Take Profit in pips.
Key Features
Automatic Range & Fibonacci Analysis: Automatically draws the primary trading range and key Fib levels, updating as market structure evolves.
Historical Backtesting: Plots all historical trade entries based on the strategy rules, allowing for a complete performance review over the chosen chart history.
Detailed Trade Visuals: Displays active trades on the chart with clear lines and boxes for entry, stop loss, and take profit zones.
Advanced Session Filtering: Allows you to isolate trades to specific market sessions (London, New York, Asia) with timezone support and daily trade limits.
Built-in Risk Management: A cornerstone of the system. It automatically calculates the required position size for each trade based on your specified Account Size, Risk Percentage, and Stop Loss.
Comprehensive Performance Tables: The script includes two powerful analytical tables:
Trade Helper Table: Shows the status of live or potential upcoming trades, including entry/SL/TP prices and the calculated position size.
History Table: Logs all recent trades and calculates key statistics like Profit Factor, Win Rate, and the overall PnL impact on your account balance.
Customizable Strategy: Fine-tune every aspect of the strategy with inputs for the lookback period, SL/TP in pips, which Fib levels are tradable, and a cooldown timer to prevent over-trading.
How to Use
Add the indicator to your chart.
Navigate to the settings and, under "Account Settings," configure your Account Size and Risk Per Trade (%). This is essential for the PnL and position sizing calculations to be meaningful.
Under "Session Filter Settings," adjust the sessions you wish to trade.
Analyze the historical trades and the performance tables to understand the strategy's behaviour on your chosen asset and timeframe.
Disclaimer: This is a tool for strategy analysis and backtesting. It is not financial advice. Past performance is not indicative of future results. Always use proper risk management.

S4_IBS_Mean_Rev_3candleExitOverview:
This is a rules-based, mean reversion strategy designed to trade pullbacks using the Internal Bar Strength (IBS) indicator. The system looks for oversold conditions based on IBS, then enters long trades , holding for a maximum of 3 bars or until the trade becomes profitable.
The strategy includes:
✅ Strict entry rules based on IBS
✅ Hardcoded exit conditions for risk management
✅ A clean visual table summarizing key performance metrics
How It Works:
1. Internal Bar Strength (IBS) Setup:
The IBS is calculated using the previous bar’s price range:
IBS = (Previous Close - Previous Low) / (Previous High - Previous Low)
IBS values closer to 0 indicate price is near the bottom of the previous range, suggesting oversold conditions.
2. Entry Conditions:
IBS must be ≤ 0.25, signaling an oversold setup.
Trade entries are only allowed within a user-defined backtest window (default: 2024).
Only one trade at a time is permitted (long-only strategy).
3. Exit Conditions:
If the price closes higher than the entry price, the trade exits with a profit.
If the trade has been open for 3 bars without showing profit, the trade is forcefully exited.
All trades are closed automatically at the end of the backtest window if still open.
Additional Features:
📊 A real-time performance metrics table is displayed on the chart, showing:
- Total trades
- % of profitable trades
- Total P&L
- Profit Factor
- Max Drawdown
- Best/Worst trade performance
📈 Visual markers indicate trade entries (green triangle) and exits (red triangle) for easy chart interpretation.
Who Is This For?
This strategy is designed for:
✅ Traders exploring systematic mean reversion approaches
✅ Those who prefer strict, rules-based setups with no subjective decision-making
✅ Traders who want built-in performance tracking directly on the chart
Note: This strategy is provided for educational and research purposes. It is a backtested model and past performance does not guarantee future results. Users should paper trade and validate performance before considering real capital.

Trend Scanner ProTrend Scanner Pro, Robust Trend Direction and Strength Estimator
Trend Scanner Pro is designed to evaluate the current market trend with maximum robustness, providing both direction and strength based on statistically reliable data.
This indicator builds upon the core logic of a previous script I developed, called Best SMA Finder. While the original script focused on identifying the most profitable SMA length based on backtested trade performance, Trend Scanner Pro takes that foundation further to serve a different purpose: analyzing and quantifying the actual trend state in real time.
It begins by testing hundreds of SMA lengths, from 10 to 1000 periods. Each one is scored using a custom robustness formula that combines profit factor, number of trades, and win rate. Only SMAs with a sufficient number of trades are retained, ensuring statistical validity and avoiding curve fitting.
The SMA with the highest robustness score is selected as the dynamic reference point. The script then calculates how far the price deviates from it using rolling standard deviation, assigning a trend strength score from -5 (strong bearish) to +5 (strong bullish), with 0 as neutral.
Two detection modes are available:
Slope mode, based on SMA slope reversals
Bias mode, based on directional shifts relative to deviation zones
Optional features:
Deviation bands for visual structure
Candle coloring to reflect trend strength
Compact table showing real-time trend status
This tool is intended for traders who want an adaptive, objective, and statistically grounded assessment of market trend conditions.

5EMA_BB_ScalpingWhat?
In this forum we have earlier published a public scanner called 5EMA BollingerBand Nifty Stock Scanner , which is getting appreciated by the community. That works on top-40 stocks of NSE as a scanner.
Whereas this time, we have come up with the similar concept as a stand-alone indicator which can be applied for any chart, for any timeframe to reap the benifit of reversal trading.
How it works?
This is essentially a reversal/divergence trading strategy, based on a widely used strategy of Power-of-Stocks 5EMA.
To know the divergence from 5-EMA we just check if the high of the candle (on closing) is below the 5-EMA. Then we check if the closing is inside the Bollinger Band (BB). That's a Buy signal. SL: low of the candle, T: middle and higher BB.
Just opposite for selling. 5-EMA low should be above 5-EMA and closing should be inside BB (lesser than BB higher level). That's a Sell signal. SL: high of the candle, T: middle and lower BB.
Along with we compare the current bar's volume with the last-20 bar VWMA (volume weighted moving average) to determine if the volume is high or low.
Present bar's volume is compared with the previous bar's volume to know if it's rising or falling.
VWAP is also determined using `ta.vwap` built-in support of TradingView.
The Bolling Band width is also notified, along with whether it is rising or falling (comparing with previous candle).
What's special?
We love this reversal trading, as it offers many benifits over trend following strategies:
Risk to Reward (RR) is superior.
It _Does Hit_ stop losses, but the stop losses are tiny.
Means, althrough the Profit Factor looks Nahh , however due to superior RR, end of day it ended up in green.
When the day is sideways, it's difficult to trade in trending strategies. This sort of volatility, reversal strategies works better.
It's always tempting to go agaist the wind. Whole world is in Put/PE and you went opposite and enter a Call/CE. And turns out profitable! That's an amazing feeling, as a trader :)
How to trade using this?
* Put any chart
* Apply this screener from Indicators (shortcut to launch indicators is just type / in your keyboard).
* It will show you the Green up arrow when buy alert comes or red down arrow when sell comes. * Also on the top right it will show the latest signal with entry, SL and target.
Disclaimer
* This piece of software does not come up with any warrantee or any rights of not changing it over the future course of time.
* We are not responsible for any trading/investment decision you are taking out of the outcome of this indicator.

ORB 5M + VWAP + Braid Filter + TP 2R o Niveles PreviosORB 5-Minute Breakout Strategy Summary
Strategy Name:
ORB 5M + VWAP + Braid Filter + TP 2R or Previous Levels
Timeframe:
5-minute chart
Trading Window:
9:35 AM to 11:00 AM (New York time)
✅ Entry Conditions:
Opening Range: Defined from 9:30 to 9:35 AM (first 5-minute candle).
Breakout Entry:
Long trade: Price breaks above the opening range high.
Short trade: Price breaks below the opening range low.
Confirmation Filters (All must be met):
Strong candle (green for long, red for short).
VWAP in the direction of the trade.
Braid Filter by Mango2Juice supports the breakout direction (green for long, red for short).
📉 Stop Loss:
Placed at the opposite side of the opening range.
🎯 Take Profit (TP):
+2R (Risk-to-Reward Ratio of 2:1),
or
Closest of the following: previous day’s high/low or premarket levels.
⚙️ Additional Rules:
Only valid signals between 9:35 and 11:00 AM.
Only one trade per breakout direction per day.
Filter out "trap candles" (very small or indecisive candles).
Avoid trading after 11:00 AM.
📊 Performance Goals:
Maintain a high Profit Factor (above 3 ideally).
Focus on tickers with good historical performance under this strategy (e.g., AMZN, PLTR, CVNA).

Smart Fib StrategySmart Fibonacci Strategy
This advanced trading strategy combines the power of adaptive SMA entries with Fibonacci-based exit levels to create a comprehensive trend-following system that self-optimizes based on historical market conditions. Credit goes to Julien_Eche who created the "Best SMA Finder" which received an Editors Pick award.
Strategy Overview
The Smart Fibonacci Strategy employs a two-pronged approach to trading:
1. Intelligent Entries: Uses a self-optimizing SMA (Simple Moving Average) to identify optimal entry points. The system automatically tests multiple SMA lengths against historical data to determine which period provides the most robust trading signals.
2. Fibonacci-Based Exits: Implements ATR-adjusted Fibonacci bands to establish precise exit targets, with risk-management options ranging from conservative to aggressive.
This dual methodology creates a balanced system that adapts to changing market conditions while providing clear visual reference points for trade management.
Key Features
- **Self-Optimizing Entries**: Automatically calculates the most profitable SMA length based on historical performance
- **Adjustable Risk Parameters**: Choose between low-risk and high-risk exit targets
- **Directional Flexibility**: Trade long-only, short-only, or both directions
- **Visualization Tools**: Customizable display of entry lines and exit bands
- **Performance Statistics**: Comprehensive stats table showing key metrics
- **Smoothing Option**: Reduces noise in the Fibonacci bands for cleaner signals
Trading Rules
Entry Signals
- **Long Entry**: When price crosses above the blue center line (optimal SMA)
- **Short Entry**: When price crosses below the blue center line (optimal SMA)
### Exit Levels
- **Low Risk Option**: Exit at the first Fibonacci band (1.618 * ATR)
- **High Risk Option**: Exit at the second Fibonacci band (2.618 * ATR)
Strategy Parameters
Display Settings
- Toggle visibility of the stats table and indicator components
Strategy Settings
- Select trading direction (long, short, or both)
- Choose exit method (low risk or high risk)
- Set minimum trades threshold for SMA optimization
SMA Settings
- Option to use auto-optimized or fixed-length SMA
- Customize SMA length when using fixed option
Fibonacci Settings
- Adjust ATR period and SMA basis for Fibonacci bands
- Enable/disable smoothing function
- Customize Fibonacci ratio multipliers
Appearance Settings
- Modify colors, line widths, and transparency
Optimization Methodology
The strategy employs a sophisticated optimization algorithm that:
1. Tests multiple SMA lengths against historical data
2. Evaluates performance based on trade count, profit factor, and win rate
3. Calculates a "robustness score" that balances profitability with statistical significance
4. Selects the SMA length with the highest robustness score
This ensures that the strategy's entry signals are continuously adapting to the most effective parameters for current market conditions.
Risk Management
Position sizing is fixed at $2,000 per trade, allowing for consistent exposure across all trading setups. The Fibonacci-based exit system provides two distinct risk management approaches:
- **Conservative Approach**: Using the first Fibonacci band for exits produces more frequent but smaller wins
- **Aggressive Approach**: Using the second Fibonacci band allows for larger potential gains at the cost of increased volatility
Ideal Usage
This strategy is best suited for:
- Trending markets with clear directional moves
- Timeframes from 4H to Daily for most balanced results
- Instruments with moderate volatility (stocks, forex, commodities)
Traders can further enhance performance by combining this strategy with broader market analysis to confirm the prevailing trend direction.

Daily Breakout + Daily Shadow By RouroThis script is a Pine v5 strategy designed to detect daily candle body breakouts and execute them on any intraday timeframe, while also providing:
Daily Data Retrieval
Using request.security(..., "D", ...) it fetches the OHLC and timestamp of the daily candle, regardless of the chart’s current timeframe.
Calculation of Yesterday’s and Day-Before-Yesterday’s Bodies
b1High and b1Low → the high/low of yesterday’s daily candle body
b2High and b2Low → the high/low of the previous day’s body
Detection of the First Intraday Bar After a New Day
By using ta.change(time("D")), it marks the start of each new trading day.
Drawing the Previous Day’s “Shadow” on the Chart
It overlays a box (box.new) and two wick lines (line.new) with configurable colors and transparency, so you can clearly see the full range of yesterday’s candle on any intraday chart.
Automatic End-of-Day Position Closure
It will automatically close any open position at the start of the next day to avoid unintended rollovers.
Entry Signals
On the very first intraday bar after the daily close:
Long if yesterday’s close broke above the body of the day before yesterday
Short if yesterday’s close broke below the body of the day before yesterday
…which triggers a strategy.entry at the intraday open.
Fully Customizable Stop-Loss and Take-Profit
SL options:
Opposite end of yesterday’s body
Fixed pips from entry
A risk-reward ratio on yesterday’s wick
Optional “safety SL” in fixed pips that overrides the above
TP options:
Fixed pips
Yesterday’s wick extreme (high/low)
Partial exit on the wick (TP1), then second exit (TP2) either:
At a multiplied RR
Or at the daily close (“Close of Day”)
You can also choose to move SL to breakeven after TP1 is hit.
Live Metrics Table
In the upper-right corner it displays in real time:
Start of backtest (date of first trade)
Number of ✅ Winning trades and ❌ Losing trades
Total number of trades
Win rate (%)
Profit Factor
All within a fixed table layout so it never runs out of rows or columns.

Williams %R StrategyThe Williams %R Strategy implemented in Pine Script™ is a trading system based on the Williams %R momentum oscillator. The Williams %R indicator, developed by Larry Williams in 1973, is designed to identify overbought and oversold conditions in a market, helping traders time their entries and exits effectively (Williams, 1979). This particular strategy aims to capitalize on short-term price reversals in the S&P 500 (SPY) by identifying extreme values in the Williams %R indicator and using them as trading signals.
Strategy Rules:
Entry Signal:
A long position is entered when the Williams %R value falls below -90, indicating an oversold condition. This threshold suggests that the market may be near a short-term bottom, and prices are likely to reverse or rebound in the short term (Murphy, 1999).
Exit Signal:
The long position is exited when:
The current close price is higher than the previous day’s high, or
The Williams %R indicator rises above -30, indicating that the market is no longer oversold and may be approaching an overbought condition (Wilder, 1978).
Technical Analysis and Rationale:
The Williams %R is a momentum oscillator that measures the level of the close relative to the high-low range over a specific period, providing insight into whether an asset is trading near its highs or lows. The indicator values range from -100 (most oversold) to 0 (most overbought). When the value falls below -90, it indicates an oversold condition where a reversal is likely (Achelis, 2000). This strategy uses this oversold threshold as a signal to initiate long positions, betting on mean reversion—an established principle in financial markets where prices tend to revert to their historical averages (Jegadeesh & Titman, 1993).
Optimization and Performance:
The strategy allows for an adjustable lookback period (between 2 and 25 days) to determine the range used in the Williams %R calculation. Empirical tests show that shorter lookback periods (e.g., 2 days) yield the most favorable outcomes, with profit factors exceeding 2. This finding aligns with studies suggesting that shorter timeframes can effectively capture short-term momentum reversals (Fama, 1970; Jegadeesh & Titman, 1993).
Scientific Context:
Mean Reversion Theory: The strategy’s core relies on mean reversion, which suggests that prices fluctuate around a mean or average value. Research shows that such strategies, particularly those using oscillators like Williams %R, can exploit these temporary deviations (Poterba & Summers, 1988).
Behavioral Finance: The overbought and oversold conditions identified by Williams %R align with psychological factors influencing trading behavior, such as herding and panic selling, which often create opportunities for price reversals (Shiller, 2003).
Conclusion:
This Williams %R-based strategy utilizes a well-established momentum oscillator to time entries and exits in the S&P 500. By targeting extreme oversold conditions and exiting when these conditions revert or exceed historical ranges, the strategy aims to capture short-term gains. Scientific evidence supports the effectiveness of short-term mean reversion strategies, particularly when using indicators sensitive to momentum shifts.
References:
Achelis, S. B. (2000). Technical Analysis from A to Z. McGraw Hill.
Fama, E. F. (1970). Efficient Capital Markets: A Review of Theory and Empirical Work. The Journal of Finance, 25(2), 383-417.
Jegadeesh, N., & Titman, S. (1993). Returns to Buying Winners and Selling Losers: Implications for Stock Market Efficiency. The Journal of Finance, 48(1), 65-91.
Murphy, J. J. (1999). Technical Analysis of the Financial Markets: A Comprehensive Guide to Trading Methods and Applications. New York Institute of Finance.
Poterba, J. M., & Summers, L. H. (1988). Mean Reversion in Stock Prices: Evidence and Implications. Journal of Financial Economics, 22(1), 27-59.
Shiller, R. J. (2003). From Efficient Markets Theory to Behavioral Finance. Journal of Economic Perspectives, 17(1), 83-104.
Williams, L. (1979). How I Made One Million Dollars… Last Year… Trading Commodities. Windsor Books.
Wilder, J. W. (1978). New Concepts in Technical Trading Systems. Trend Research.
This explanation provides a scientific and evidence-based perspective on the Williams %R trading strategy, aligning it with fundamental principles in technical analysis and behavioral finance.

Moving Average Trap Strategy by D. BrigagliaThis is a strategy that follows the 200 periods moving average and fades the cross of ma3, ma5 and ma8. It is designed for profiting by mean reversion while at the same time respecting long term trend. It is designed for long term trending markets such as stocks and stock indices.
In this backtest, the strategy shows the ability to beat the S&P500 index with an average slippage set to 2 ticks. The number of trades is good (350), the profit factor is acceptable (1.67). The drawdowns are also reduced compared to the underlying asset.
Nothing of my content is financial advice.
